Perfecting Metacore’s data tech stack


As a mobile game company, Metacore gathers and processes vast amounts of data. This raw data is transformed, combined, and analyzed to turn it into information insights. These insights take many forms—dashboards visualizations, analyses by data analysts, or predictions from machine learning models—all helping our game developers make better decisions and create more delightful experiences for our players.
In this blog, Metacore’s Data Analyst Joonas Kekki, Analytics Engineer Tuukka Järvinen and Analytics Consultant Janne Koivunen discuss how Metacore future-proofed their reporting tool Looker and built the foundation for a shared semantic layer to be used for AI use cases.
The challenge is in the metadata
Metacore has built its data tech stack by carefully evaluating and choosing modern state-of-the-art tools, like Snowflake as a data warehouse, dbt as a data pipeline tool and Looker as a business intelligence tool. Despite having modern tools the challenge has been that even though the tools do share data between them, they do not share all the metadata (data about data).
As a concrete example, data fields and data table connections (joins) are well described and defined in Looker but those descriptions aren’t shared with Snowflake or dbt. This limits and slows down both people working with these tools and the development of new data products, like conversational AI tools.
The semantic layer, where business logic is defined, is great in theory. In practice, not so much.
Shadow analytics bypass Looker, lacking oversight, common metric definitions, and peer review. There's a reason for this—who doesn’t love a viral SQL query? But we want to reduce repetition and manual work, and explaining field relationships and internal team terminology to various LLMs is another challenge.
Looker at Metacore

Looker and its role at Metacore’s day-to-day
Let’s dive a bit deeper into the role of Looker in Metacore’s data tech stack. Looker serves all Metacoreans with over 3,500 pieces of saved content (charts, dashboards and standalone charts) that are accessed monthly.
Concretely, with Looker’s LookML coding language, you write SQL expressions once, in one place, and Looker uses the code repeatedly to generate SQL queries based on the needs of the end users, such as performance marketing specialists, product managers, and game designers. Looker’s way of working is in contrast to many other business intelligence and reporting tools, where one manually creates independent code for each and every chart.
For Metacore, Looker is the place where our data experts have put a lot of effort into describing all data fields with detailed descriptions and connections between data tables, both of which are essential for business understanding. Looker is the tool where Metacore defines how all the company’s critical metrics and KPIs are calculated.
That being the case, it’s clear that Looker is a key component of Metacore’s data stack. However, at times, it can feel too much like an island, keeping valuable business information isolated and making it harder to fully leverage Metacore's data tech stack.
Tale of three data projects
In order to take steps towards unified metadata or a semantic layer across the whole data tech stack and both minimising and future-proofing the development work in Looker, Metacore started three projects last year.We began increasing the level of automation in producing LookML code, abstracting and organizing the Looker codebase more like a software project, into three layers—base, logical, and presentation—for even better maintainability. Finally, we defined field descriptions directly in the dbt tool, allowing them to flow to Snowflake and Looker.
"Without refactoring the project to adopt a layered approach, Metacore would’ve eventually faced challenges with the growing maintenance workload and slower development speed."
Increasing automation
One can view writing LookML code as a necessary evil in order for one to enjoy all the benefits that will come with Looker generating the SQL on your and your end users’ behalf.
However, in larger Looker projects the amount of needed LookML code grows. Metacore decided to use its well-maintained data warehouse, Snowflake, and its metadata about the tables that were in use by the Looker system to generate the needed LookML code automatically. The solution uses Python code combined with GitHub Actions to trigger a workflow that creates a pull request to the Git repository of the Looker project.
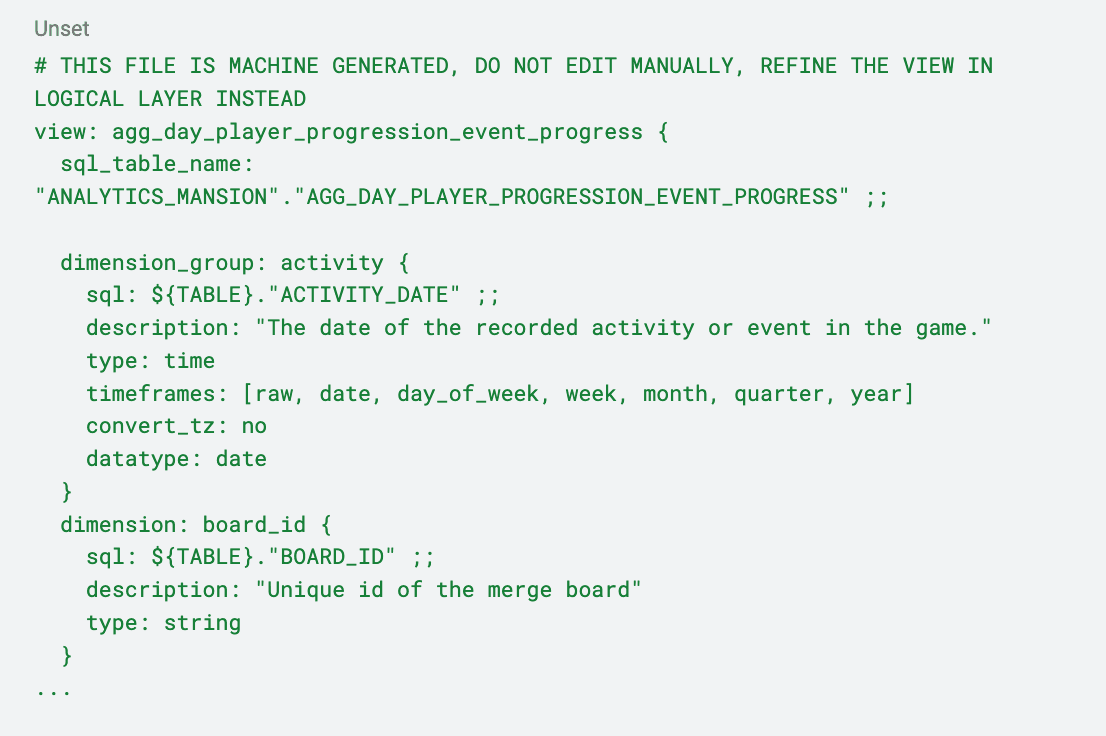
The resulting code is saved to what is called a base layer. For each database table, the script creates a Looker View file, and within it, for each column, declares a dimension or a dimension_group in case the column type is a date or a timestamp. The automation also does some nice things by default, such as pre-populating the field descriptions, removing the postfixes ‘_DATE’ and ‘_TIME’ from dimension_group names, declaring a primary key, hiding numerical dimensions, and so on, to minimize the LookML code a developer has to write.

Abstracting and layering the Looker codebase
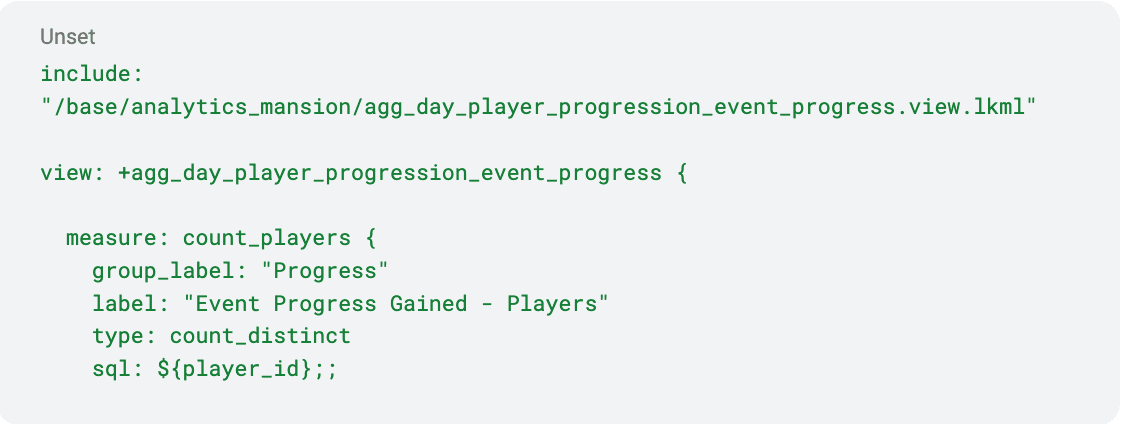
With the automated base layer in place, a Looker developer can focus on adding measures, derived dimensions, parameters and filters to the View files and building Explores and Models from the Views. A LookML technique called Refinements makes it possible to add layers of code on top of the View files in the base layer without directly editing the files created by the automation.

We chose to implement these refinements in two layers: logical and presentation. In the logical layer, we defined measures and derived dimensions, i.e., the business logic, whereas parameter-based dynamic code was refined in the presentation layer, as that kind of code is mostly motivated by providing a certain filtering functionality to a dashboard.
For better maintainability, Looker Explores were separated into their own files, and hence, Model files shrank in size by several thousand rows.
Defining field descriptions in dbt
Dbt allows you to add descriptions for columns and models directly during the modeling process. When this documentation is maintained consistently, dbt automatically pushes these descriptions in the underlying data warehouse, such as Snowflake in our case. Looker can then read this metadata directly, seamlessly transferring field descriptions from the data layer to the user interface.
This process saves time and reduces manual effort, as documentation stays synchronized across dbt, Snowflake, and Looker. At the same time, it improves data usability and ensures that the team has a shared understanding of the data structures.
Starting to document every field from the beginning of your project is a small investment that will pay off many times over.
We at Metacore, unfortunately, didn’t start adding column descriptions from the very beginning of the project. However, we managed to perform a bulk update and generate the missing descriptions for the most important columns.
We carried out the bulk update in multiple stages. First, we used Snowflake table metadata to identify all columns missing a description. Then, we adopted a mob programming-style approach to collaboratively fill in the missing descriptions as a team.
Basically, we gathered in a meeting room, took turns inputting the descriptions, and didn't leave until every single one was documented. Finally, data engineers added the new descriptions to the dbt YAML files using scripts. Simple as that!
If you need to go through the same process, you might want to check out the dbt-osmosis package, which allows you to easily generate missing YAML files for dbt.
Future is bright – introducing the results
After two months from starting, all of these projects are now successfully done.Data developers at Metacore now get to enjoy an automated, machine-generated base layer that reduces the need for manual coding by approximately 40%, improved maintainability of LookML code through abstraction and layered refinements, and shared data descriptions across the entire data tech stack. Now, Metacoreans get to continue building new data projects and AI capabilities on top of our data tech stack with a shared semantic layer. Refactoring the semantic layer caused zero downtime, with validation tools catching most bugs before users noticed—underscoring the importance of coded metrics and governance. We’ve cut manual coding, standardized naming, and unified field descriptions, moving us closer to ‘headless BI’ vision.
To sum it up, the future is bright! More about the projects mentioned in the next blog. Until then!
Is data your core skill?
We're currently looking for an experienced Analytics Engineer and a Business Intelligence Developer to join out team! Not what you're looking for? Do take a look at our other open positions in both in Helsinki and Berlin.
Related content

